mirror of
https://github.com/sebastianpauli/netgis-client.git
synced 2025-06-10 12:24:13 +02:00
185 lines
5.2 KiB
Markdown
185 lines
5.2 KiB
Markdown
# NetGIS Client Integration Tutorial
|
|
|
|
Welcome to the NetGIS Client Integration Tutorial. This is a step-by-step guide how to integrate the netgis client into a web site.
|
|
|
|
## Basic Setup
|
|
|
|
Let's start by writing a very simple, mobile-friendly HTML document where the client will be displayed:
|
|
|
|
```html
|
|
<!DOCTYPE html>
|
|
<html>
|
|
|
|
<head>
|
|
<meta http-equiv="content-type" content="text/html; charset=utf-8" />
|
|
<meta http-equiv="X-UA-Compatible" content="IE=edge" />
|
|
<meta name="viewport" content="width=device-width, initial-scale=1.0, maximum-scale=1.0, user-scalable=no" />
|
|
|
|
<title>NetGIS Client Tutorial</title>
|
|
</head>
|
|
|
|
<body>
|
|
</body>
|
|
|
|
</html>
|
|
```
|
|
|
|
Next up we need to include at least two dependencies for the client to work properly: OpenLayers for map rendering and FontAwesome for icons. Add these CSS files to the head section:
|
|
|
|
```html
|
|
<link rel="stylesheet" type="text/css" href="/libs/fontawesome/5.12.0/css/all.min.css" />
|
|
<link rel="stylesheet" type="text/css" href="/libs/openlayers/10.0.0/ol.css" />
|
|
```
|
|
|
|
And at the bottom of the body section also add the OpenLayers JS file:
|
|
|
|
```html
|
|
<script type="text/javascript" src="/libs/openlayers/10.0.0/ol.js"></script>
|
|
```
|
|
|
|
You can see the latest tested versions of these libraries in the path names.
|
|
|
|
Now let's include the pre-compiled netgis client package from the repositories ```/dist``` folder in the head:
|
|
|
|
```html
|
|
<link rel="stylesheet" type="text/css" href="../dist/netgis.min.css" />
|
|
```
|
|
|
|
And in the body:
|
|
|
|
```html
|
|
<script type="text/javascript" src="../dist/netgis.min.js"></script>
|
|
```
|
|
|
|
This tutorial is working from inside the ```/demo``` folder, so make sure your paths are correct.
|
|
|
|
## Creating The Client Instance
|
|
|
|
Once all the styles and scripts are ready, we can create our client.
|
|
First let's create a simple container element to display the client in:
|
|
|
|
```html
|
|
<div id="container" style="height: 400px"></div>
|
|
```
|
|
|
|
Then we can write the main script that will create the client instance:
|
|
|
|
```html
|
|
<script type="text/javascript">
|
|
|
|
var client = new netgis.Client( "container" );
|
|
|
|
</script>
|
|
```
|
|
|
|
But it won't work yet without a valid configuration. So let's create a config JSON object and pass it as second parameter to the client constructor:
|
|
|
|
```js
|
|
var config = {};
|
|
|
|
var client = new netgis.Client( "container", config );
|
|
```
|
|
|
|
Note that this client configuration JSON could also come from a URL or some backend script like PHP or Django.
|
|
|
|
OK, in theory we have now created a client, but it is not yet displaying anything.
|
|
|
|
Let's expand the config and define some essential client modules to display a basic menu bar and an empty map:
|
|
|
|
```js
|
|
var config =
|
|
{
|
|
"modules":
|
|
{
|
|
"menu": true,
|
|
"map": true
|
|
},
|
|
|
|
"menu":
|
|
{
|
|
"header": "Tutorial"
|
|
},
|
|
|
|
"map":
|
|
{
|
|
"center_lonlat": [ 7.0, 50.0 ],
|
|
"zoom": 14
|
|
}
|
|
};
|
|
```
|
|
|
|
So now we should see our menu with just the header text and a gray empty map area below it.
|
|
You can read about all the config options in the [Documentation](https://sebastianpauli.net/netgis/docs/global.html#Modules) of each module.
|
|
Let's add a simple image tiles layer from OpenStreetMap to show some map content by adding the layers section to the config object:
|
|
|
|
```js
|
|
"layers":
|
|
[
|
|
{ "id": "osm", "type": "OSM", "title": "Open Street Map", "attribution": "OpenStreetMap Contributors", "active": true }
|
|
]
|
|
```
|
|
|
|
This should now display the OpenStreetMap base layer for the south west of Germany according to our defined center coordinates.
|
|
|
|
## Adding More Modules
|
|
|
|
To give proper credit to the map layer providers we now add the attribution module, and the map controls module to make navigation a little easier:
|
|
|
|
```js
|
|
"modules":
|
|
{
|
|
"menu": true,
|
|
"map": true,
|
|
"attribution": true,
|
|
"controls": true
|
|
}
|
|
```
|
|
|
|
The attribution should now appear at the bottom right of the map view, but there are no map controls yet.
|
|
These (like most other menu-like modules) need their actual button items to be defined like this controls section:
|
|
|
|
```js
|
|
"controls":
|
|
{
|
|
"buttons":
|
|
[
|
|
{ "id": "zoom_in", "icon": "<i class='fas fa-plus'></i>", "title": "Zoom +" },
|
|
{ "id": "zoom_out", "icon": "<i class='fas fa-minus'></i>", "title": "Zoom -" },
|
|
{ "id": "zoom_home", "icon": "<i class='fas fa-home'></i>", "title": "Zoom Home" }
|
|
]
|
|
}
|
|
```
|
|
|
|
Note the button ids with special values that call certain actions when clicked (see [Commands](https://sebastianpauli.net/netgis/docs/global.html#Commands) in the docs).
|
|
|
|
Finally let's add a layer tree panel for layer selection.
|
|
|
|
First we need to activate the module:
|
|
|
|
```js
|
|
"layertree": true
|
|
```
|
|
|
|
We just activated the module, but the layer panel is hidden by default.
|
|
Let's add a button to the top menu to toggle the panel using the menu items section:
|
|
|
|
```js
|
|
"menu":
|
|
{
|
|
"header": "Tutorial",
|
|
"items":
|
|
[
|
|
{ "id": "layertree", "title": "<i class='fas fa-layer-group'></i><span>Layers</span>" }
|
|
]
|
|
}
|
|
```
|
|
|
|
Note the same pattern for the menu items as for the map controls. Again certain id values have special meanings, like toggling the layer tree.
|
|
|
|
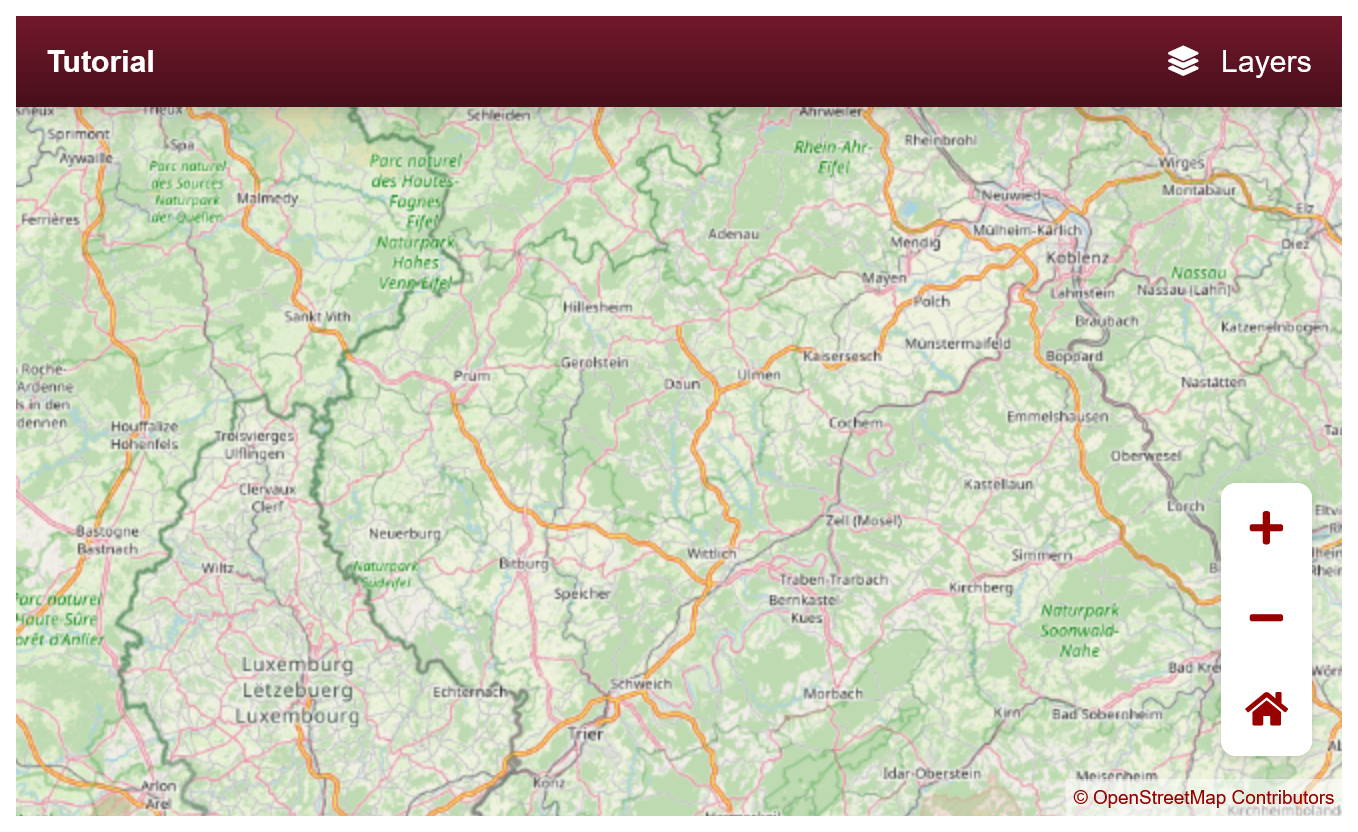
This is how the final result should look like:
|
|
|
|
|
|
|
|
That's it for the basic netgis client tutorial. You can find the complete example in [/demo/tutorial.html](https://github.com/sebastianpauli/netgis-client/blob/main/demo/tutorial.html).
|
|
Thanks for reading!
|